
From Q2 to Q3 2026, the 9 sites Digital Ingenuity manages appeared in search 20.0% more often, going from 301,157 impressions to 361,467. Over the same two quarters, clicks fell 8.8%, from 1,821 to 1,661. Click-through rate dropped from 0.605% to 0.460%. These are our DigiLabs numbers.
A word on scale before going further. This is 9 sites, and one of them is Digital Ingenuity’s own. These numbers describe our sites only. They don’t tell you what happened across the industry.
All 9 sites, Q2 to Q3
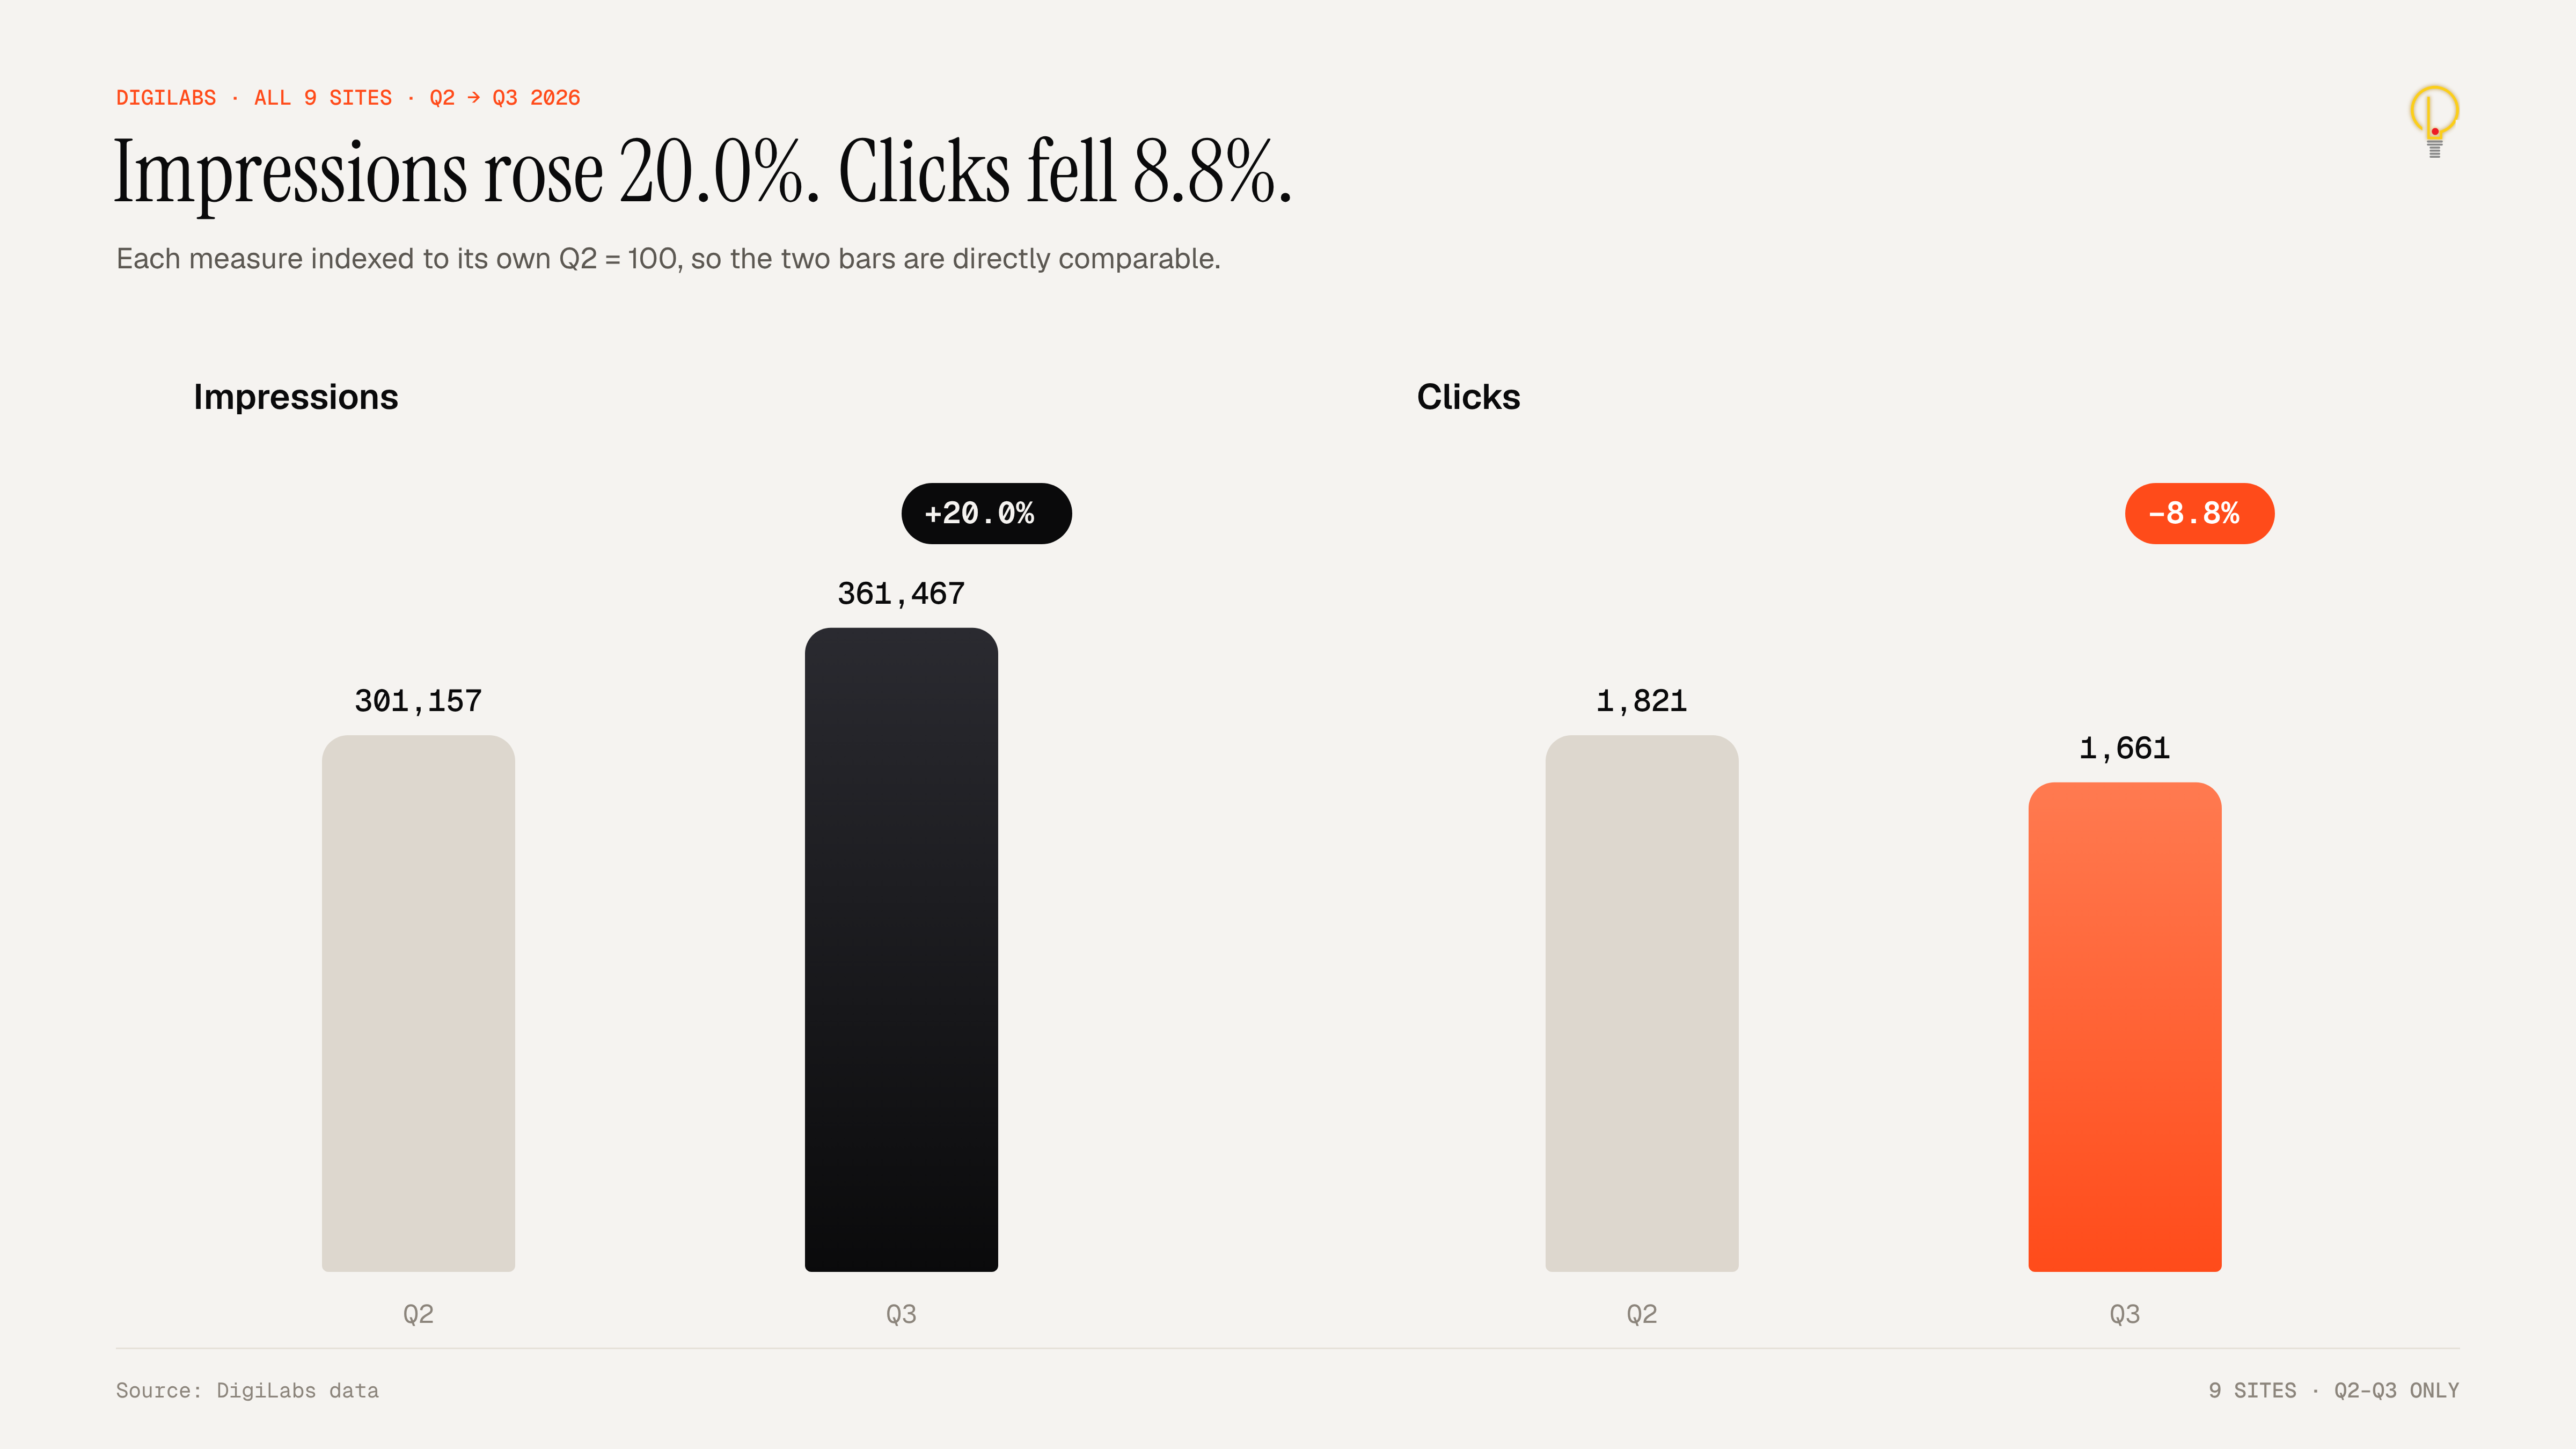 Source: DigiLabs, Digital Ingenuity. All 9 sites, Q2 and Q3 only.
The chart starts at Q2 because that’s the first quarter with data for all 9 sites.
The 7 sites with data since Q1
Two of the 9 sites joined in Q2, so we looked at the 7 sites with Q1 data on their own. From Q1 to Q3, impressions for those 7 grew 2.24 times, from 149,352 to 334,907.
Clicks for the same 7 sites rose 35.4%, from 1,120 to 1,516. Their click-through rate fell from 0.750% to 0.453%.
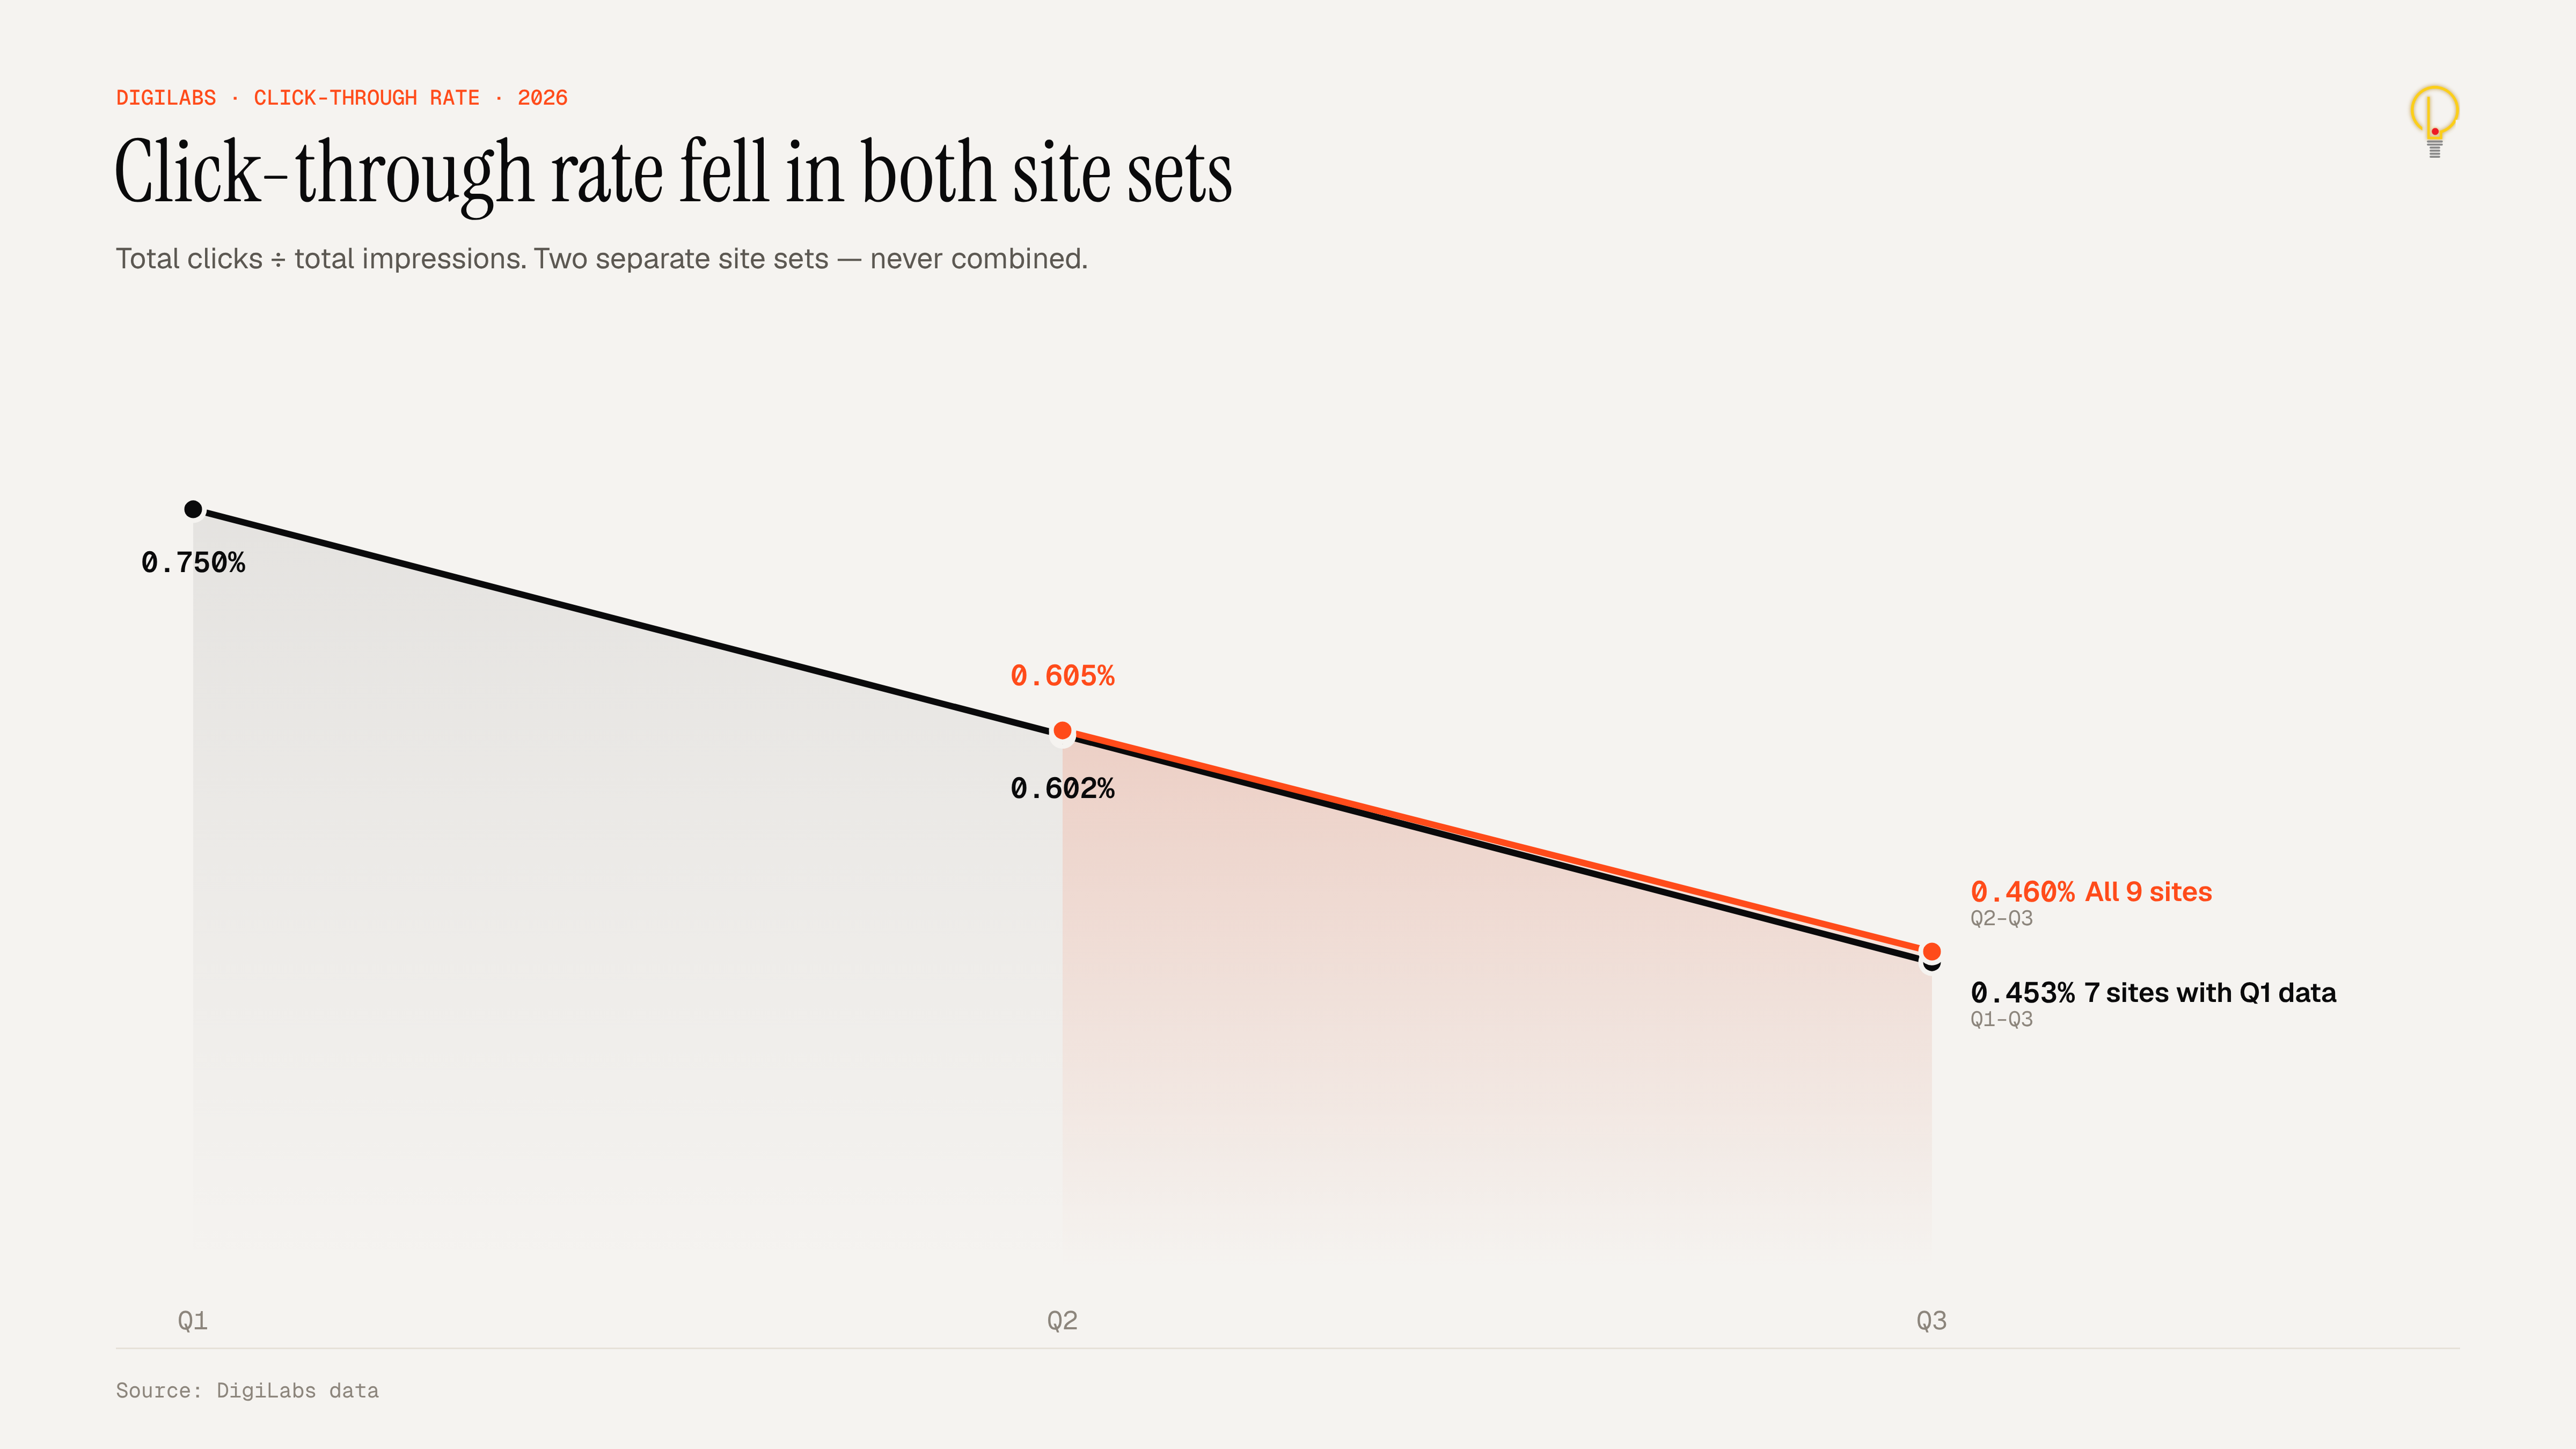 Source: DigiLabs, Digital Ingenuity. The two lines are different sets of sites and aren’t combined.
Site by site
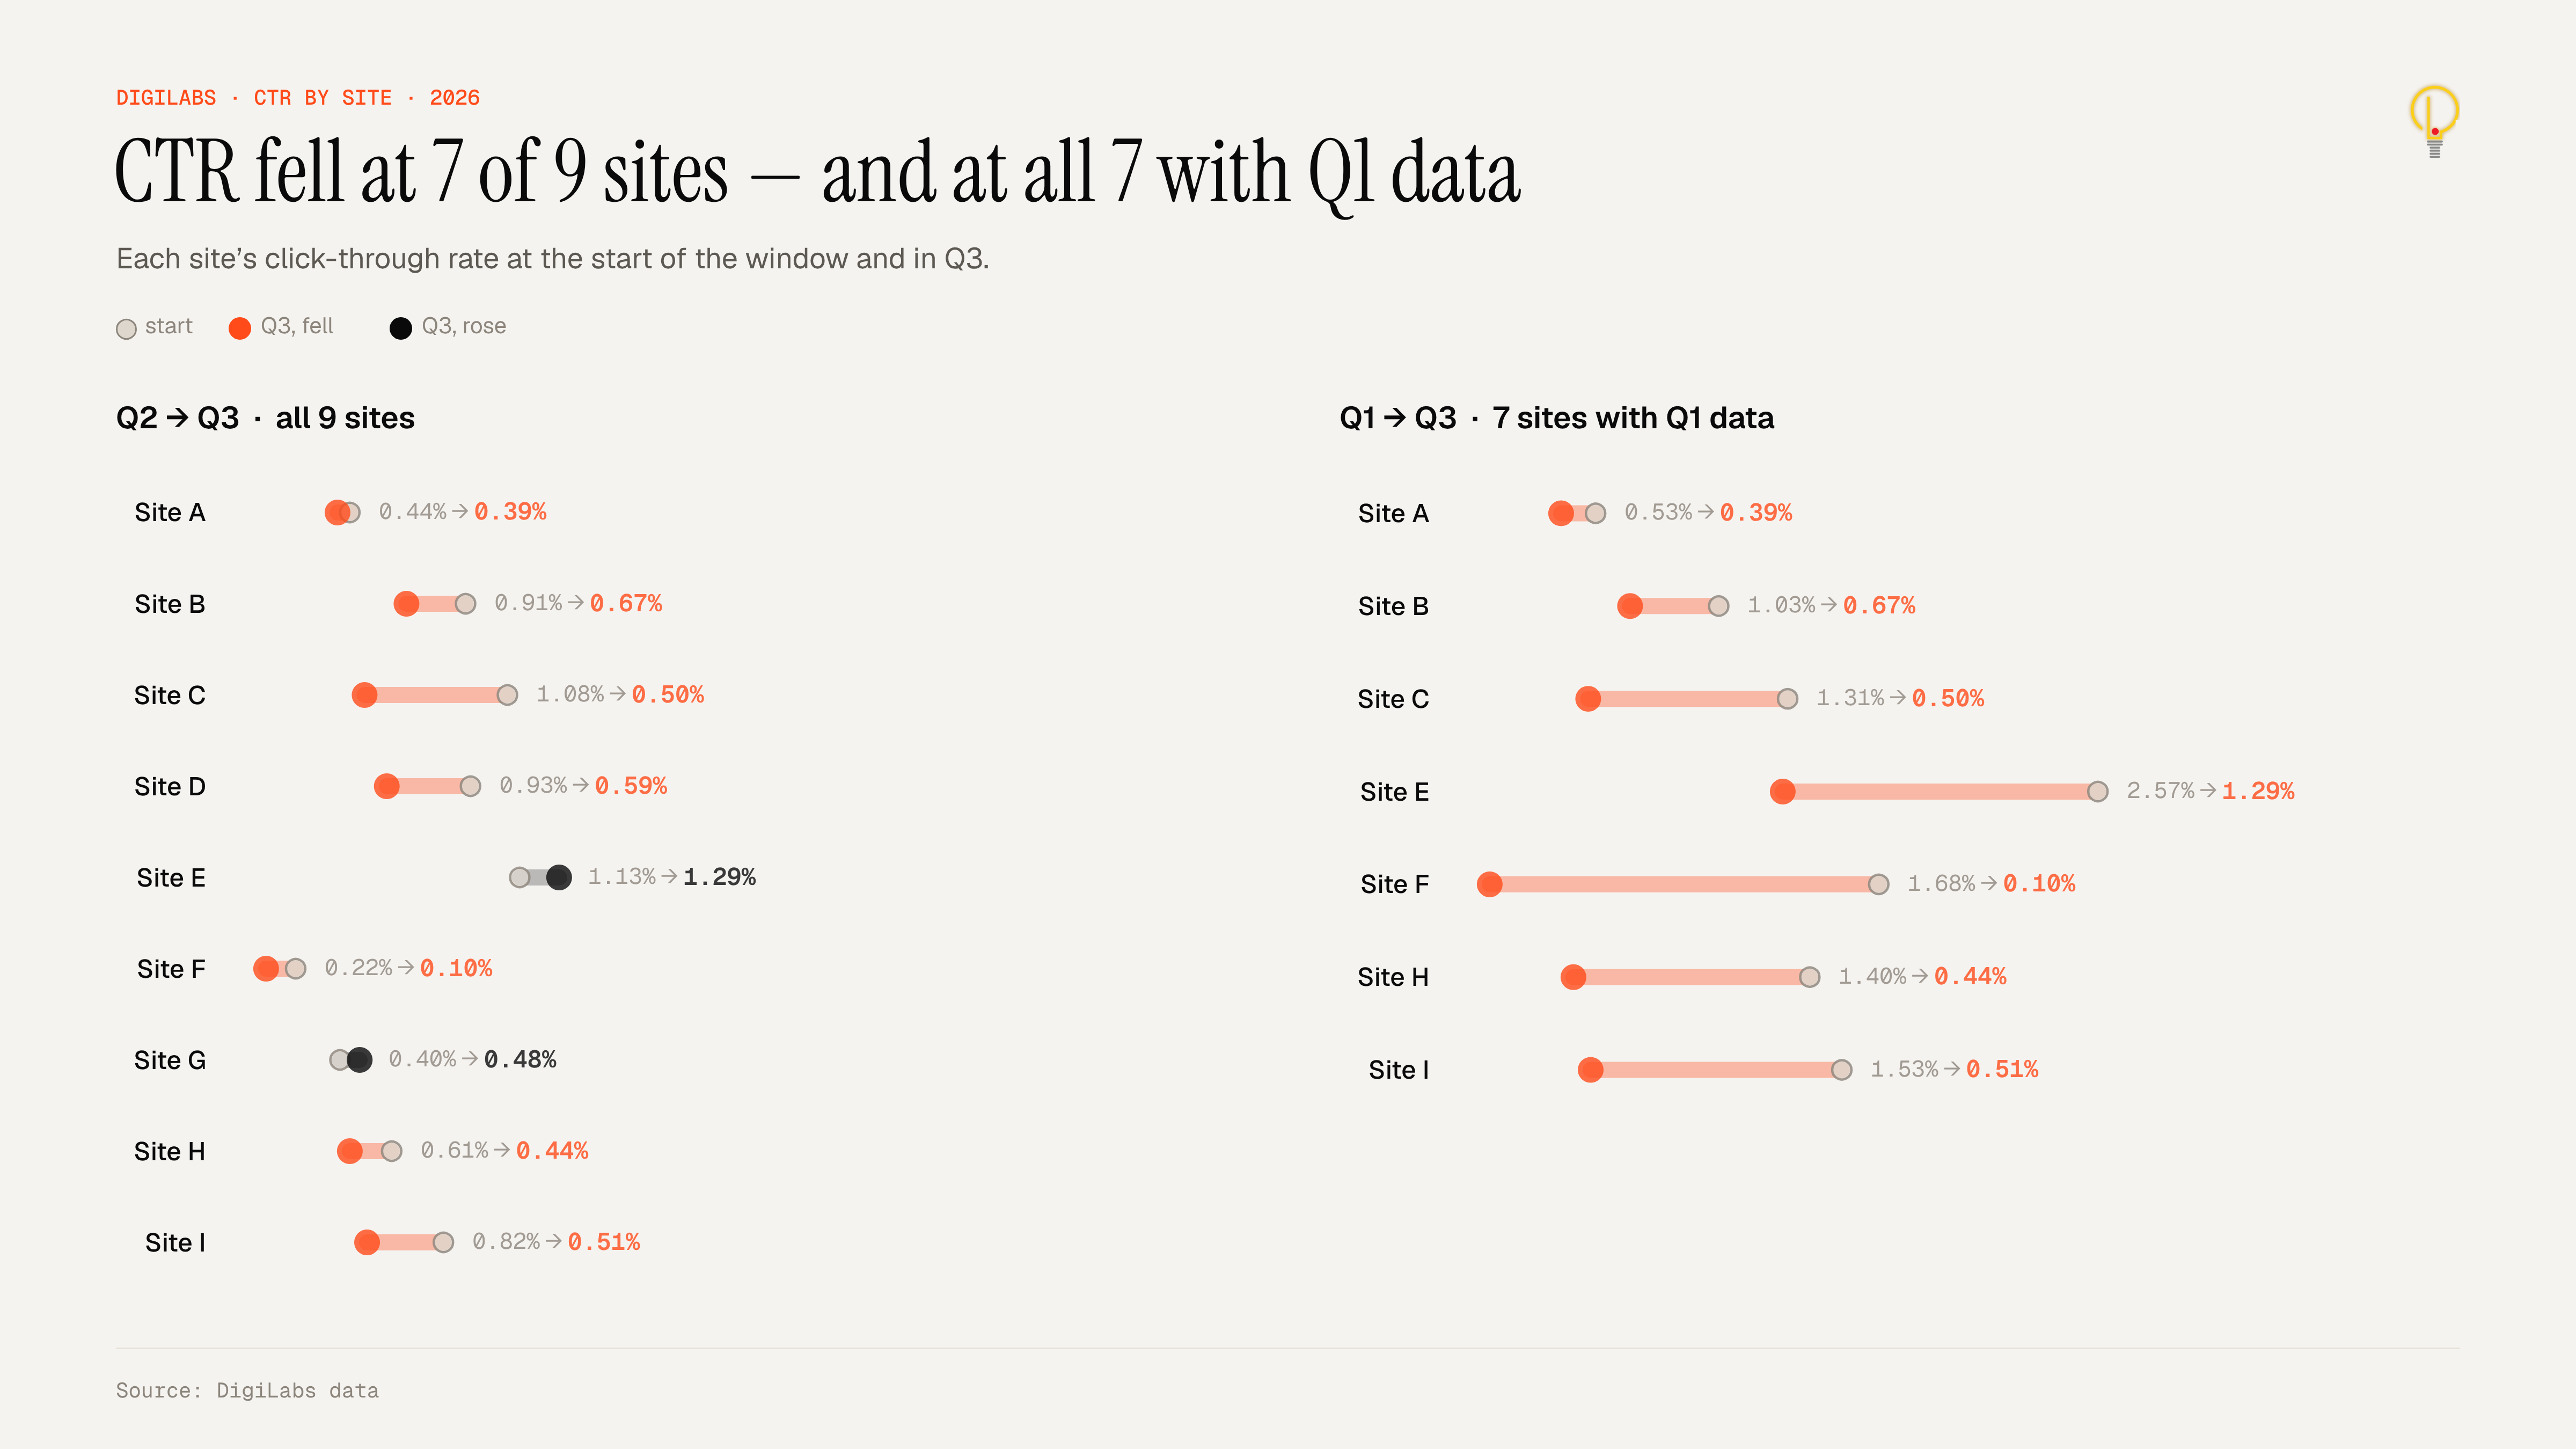 Source: DigiLabs, Digital Ingenuity. Sites are labelled A to I. Site F is Digital Ingenuity’s own site.
From Q2 to Q3, CTR fell at 7 of the 9 sites. Two went up: Site E, from 1.13% to 1.29%, and Site G, from 0.40% to 0.48%.
From Q1 to Q3, CTR fell at all 7 sites that have Q1 data. That includes Site E, which went from 2.57% to 1.29% over that window.
Site F is Digital Ingenuity’s own site. Its CTR fell from 1.68% in Q1 to 0.10% in Q3, the largest drop among the 7 sites with Q1 data.
A possible outside factor
Our data shows what changed, not why. One published study is relevant. In July 2025 the Pew Research Center reported on the Google searches of 900 U.S. adults in March 2025. When a results page showed an AI-generated summary, people clicked a regular result link on 8% of visits. When there was no summary, they did so on 15% of visits. Links inside the summary were clicked on 1% of visits. (Pew Research Center, “Google users are less likely to click on links when an AI summary appears in the results”)
Our numbers don’t show which of our impressions came from pages with AI summaries, so we aren’t saying that’s the cause here.
One thing to check on your own site
Look at clicks and click-through rate next to impressions every quarter, not at impressions alone. For our 9 sites from Q2 to Q3, impressions alone would have shown a 20.0% gain, while clicks fell 8.8%.
How we measured this
- Sites: 9 sites Digital Ingenuity manages, tracked in DigiLabs. One of them (Site F) is Digital Ingenuity’s own site. Seven have data from Q1; two joined in Q2.
- Quarters: Q1, Q2 and Q3 of 2026.
- CTR: total clicks divided by total impressions for a set of sites in a quarter. It is not an average of each site’s CTR. A site’s CTR is its own clicks divided by its own impressions.
- Two sets, kept separate: all 9 sites are compared only from Q2 to Q3. The 7 sites with Q1 data are compared from Q1 to Q3. We don’t mix the two.
- Limits: this is a small sample of 9 sites over three quarters, and two sites were added mid-year. The numbers describe these sites only.